Core Features
Lending & Borrowing Cards (Dashboard)
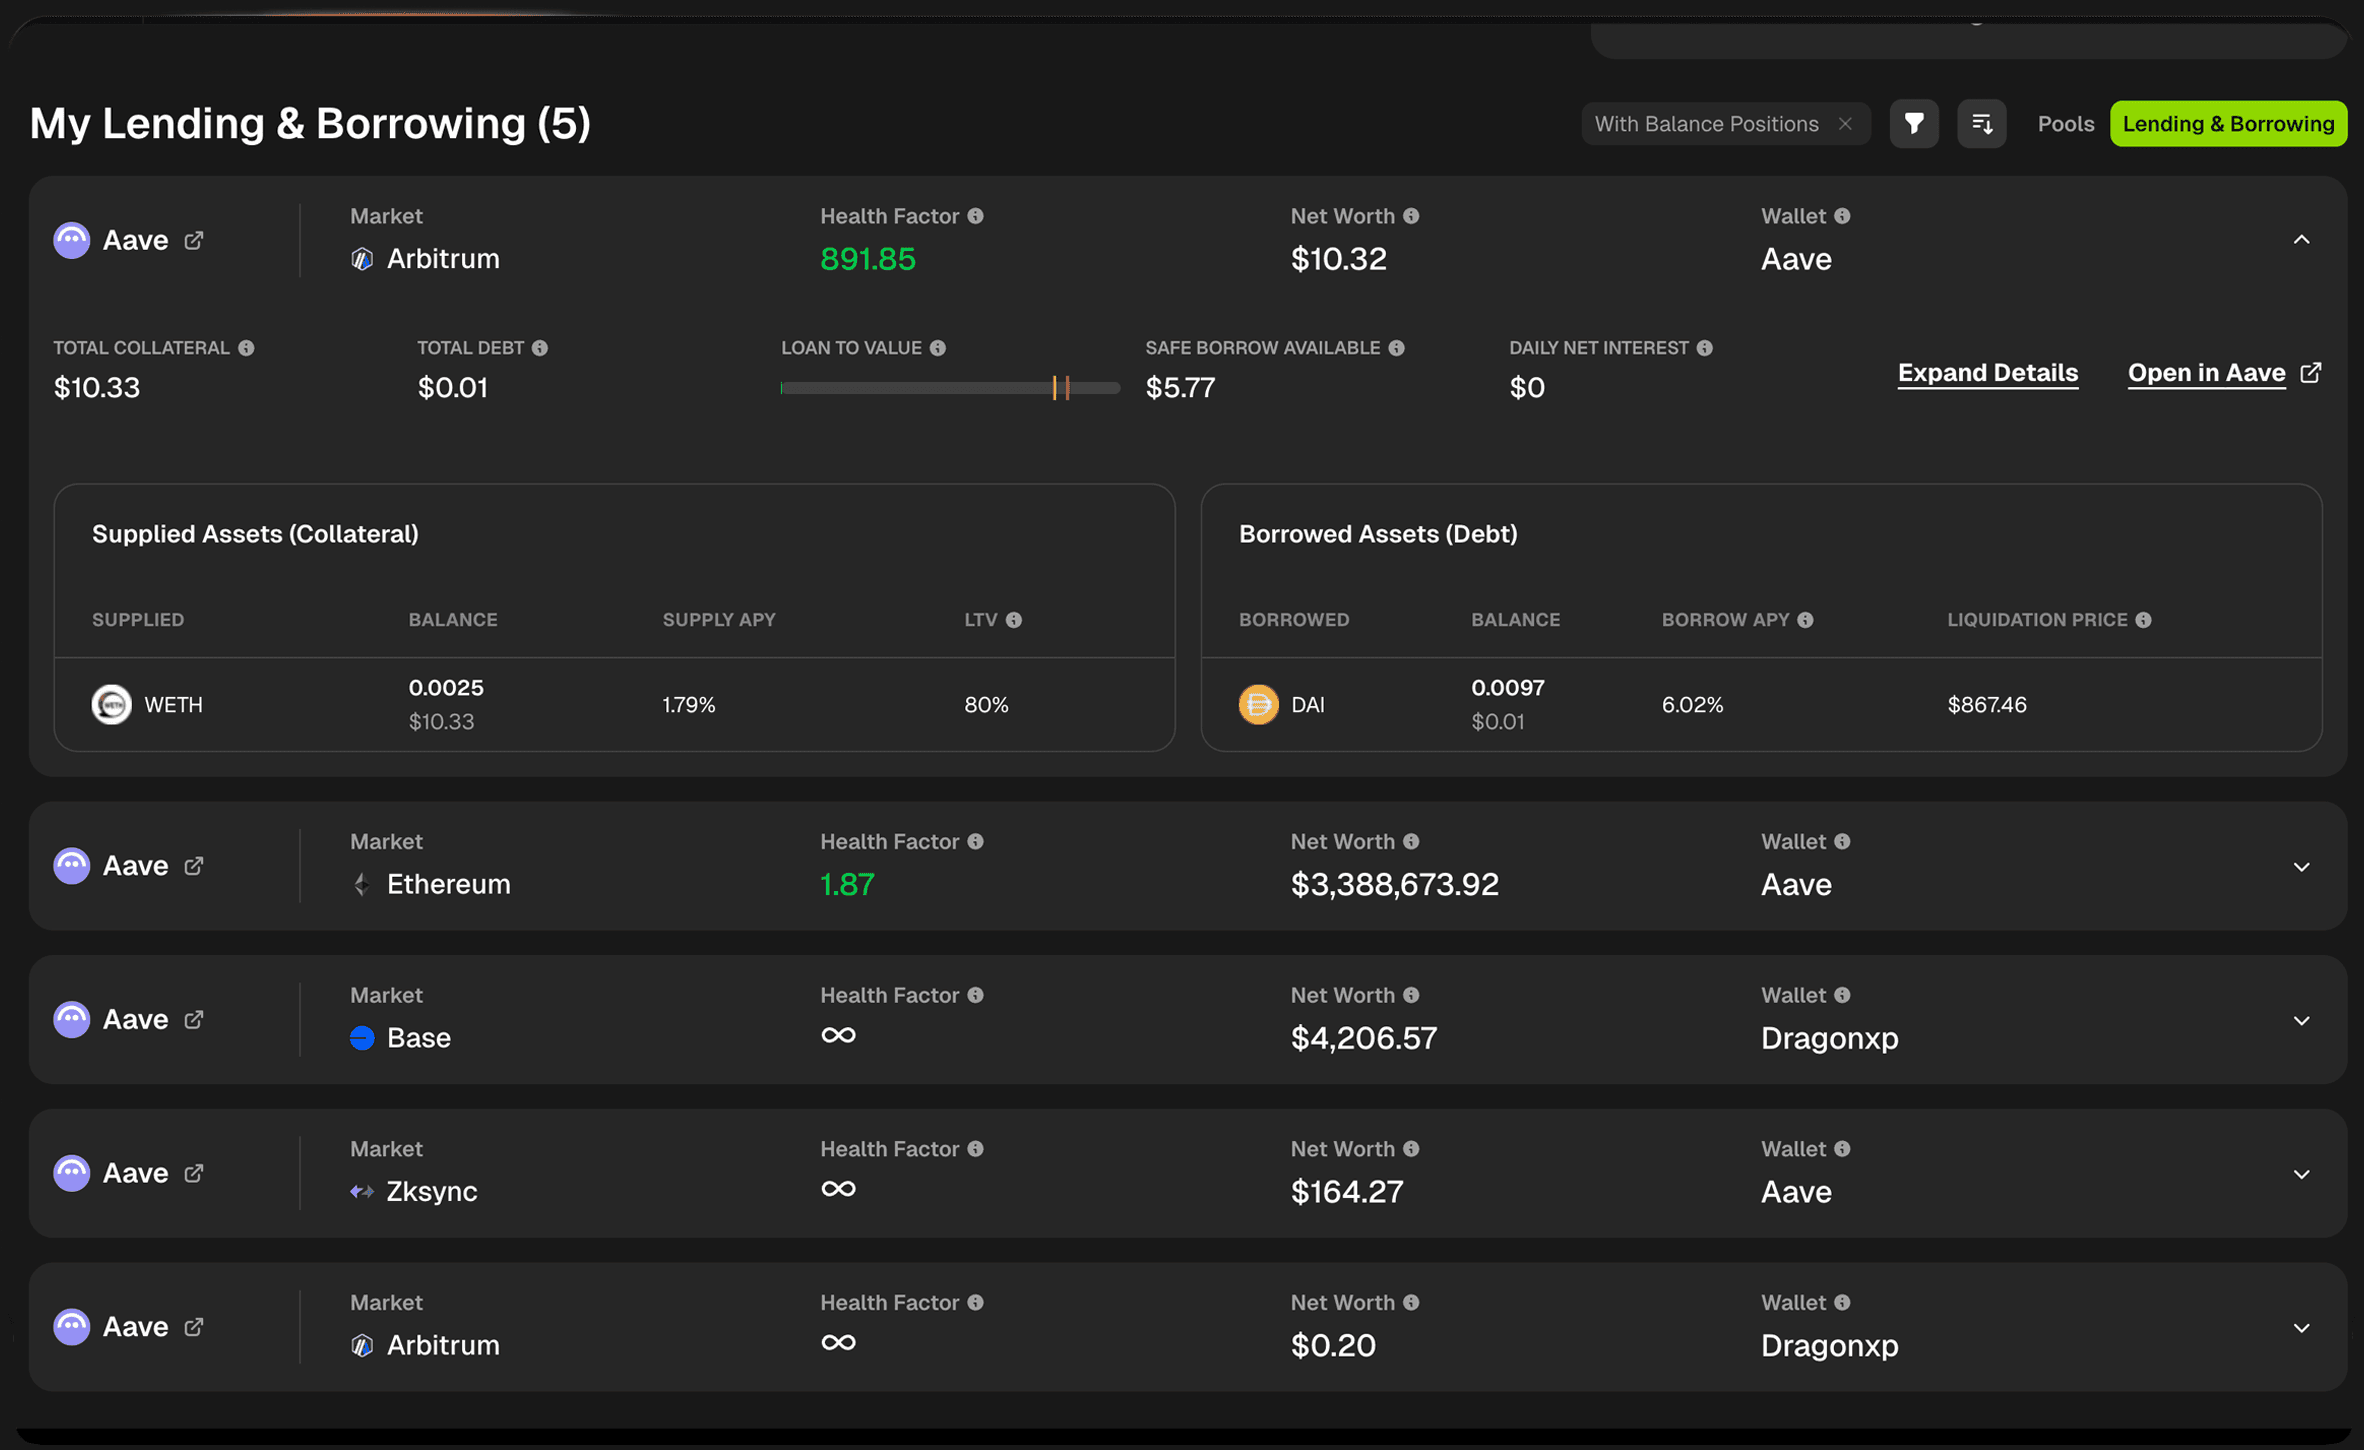
Monitor your lending and borrowing positions across protocols with real-time health factor tracking and risk assessment.
Accessing Lending & Borrowing View
From your Portfolio Dashboard:
Click the Lending & Borrowing tab in the position filters
Your view switches from liquidity pools to lending positions
All dashboard metrics update to reflect only lending/borrowing data
Position Card Overview
Each lending/borrowing position card displays key information about your position on a specific protocol and blockchain.
Position Header
Protocol & Market
Protocol logo (e.g., Aave)
Protocol name with external link icon
Market/blockchain indicator (e.g., Ethereum)
Quick Actions
Expand Details - Opens detailed position modal
Open in [Protocol] - Direct link to manage position on the protocol
Key Metrics At a Glance
Value / Metric | Description |
|---|---|
Protocol | Protocol where your collateral is supplied. |
Market | Your protocol's market |
Health Factor | Your liquidation risk indicator |
Net Worth | Total value of supplied assets minus debt |
Wallet | Which connected wallet holds this position |
Top Row Summary Metrics
Metric | Description |
|---|---|
Total Collateral | Total USD value of all assets you've supplied |
Total Debt | Total USD value of all assets you've borrowed |
Current LTV | Your current loan-to-value ratio with visual indicator |
Safe Borrow Available | How much more you can safely borrow |
Daily Net Interest | Your net interest paid or earned per day |
Understanding Current LTV
The LTV Indicator Visual bar showing your current loan-to-value ratio with three zones:
Green Zone (Safe)
Your debt is well below maximum limits
Low liquidation risk
Room to borrow more if needed
Yellow/Orange Marker
Shows your current LTV position
The closer to red, the riskier your position
Red Zone (Danger)
Approaching liquidation threshold
High risk of liquidation if prices move against you
LTV Tooltip Information:
Maximum LTV (e.g., 77.89%)
The highest LTV ratio your debt can reach as a percentage of your total collateral
This is NOT your liquidation point
Warning threshold before liquidation
Liquidation LTV (e.g., 80.54%)
The debt-to-collateral ratio at which your position CAN be liquidated
If your LTV reaches this level, liquidators can close your position
Always maintain LTV well below this threshold
Supplied Assets (Collateral) Table
View all assets you've supplied to the lending protocol:
Column | Description |
|---|---|
Supplied | Which token you've deposited as collateral |
Balance | Token amount + USD value you've supplied |
Supply APY | Annual percentage yield you're earning on this asset |
LTV | Loan-to-value ratio for this specific asset (how much you can borrow against it) |
Why Supply APY Varies: Different assets have different supply rates based on:
Protocol utilization
Asset risk profile
Market demand for borrowing that asset
Understanding Individual Asset LTV:
Higher LTV (e.g., 80%) = Can borrow more against this asset (usually stablecoins or blue chips)
Lower LTV (e.g., 65%) = Can borrow less (riskier or more volatile assets)
Borrowed Assets (Debt) Table
View all assets you've borrowed from the protocol:
Column | Description |
|---|---|
Borrowed | Which token you've borrowed |
Balance | Token amount + USD value of your debt |
Borrow APY | Annual interest rate you're paying on this loan |
Liquidation Price | Price at which this specific asset would trigger liquidation |
Why Borrow APY Varies: Borrow rates change based on:
Protocol utilization (more borrowing = higher rates)
Asset volatility
Market demand
Understanding Liquidation Price:
If the borrowed asset's price reaches this level, you're at risk of liquidation
Monitor this closely for volatile assets
Multiple borrowed assets = multiple liquidation prices to track
Join our Discord Server
Any other questions? Get in touch