

Note: This page covers the Pools view. For lending and borrowing positions, see Lending & Borrowing Dashboard. For whole-wallet holdings beyond your DeFi positions, see the Portfolio page in the sidebar.
Dashboard Overview
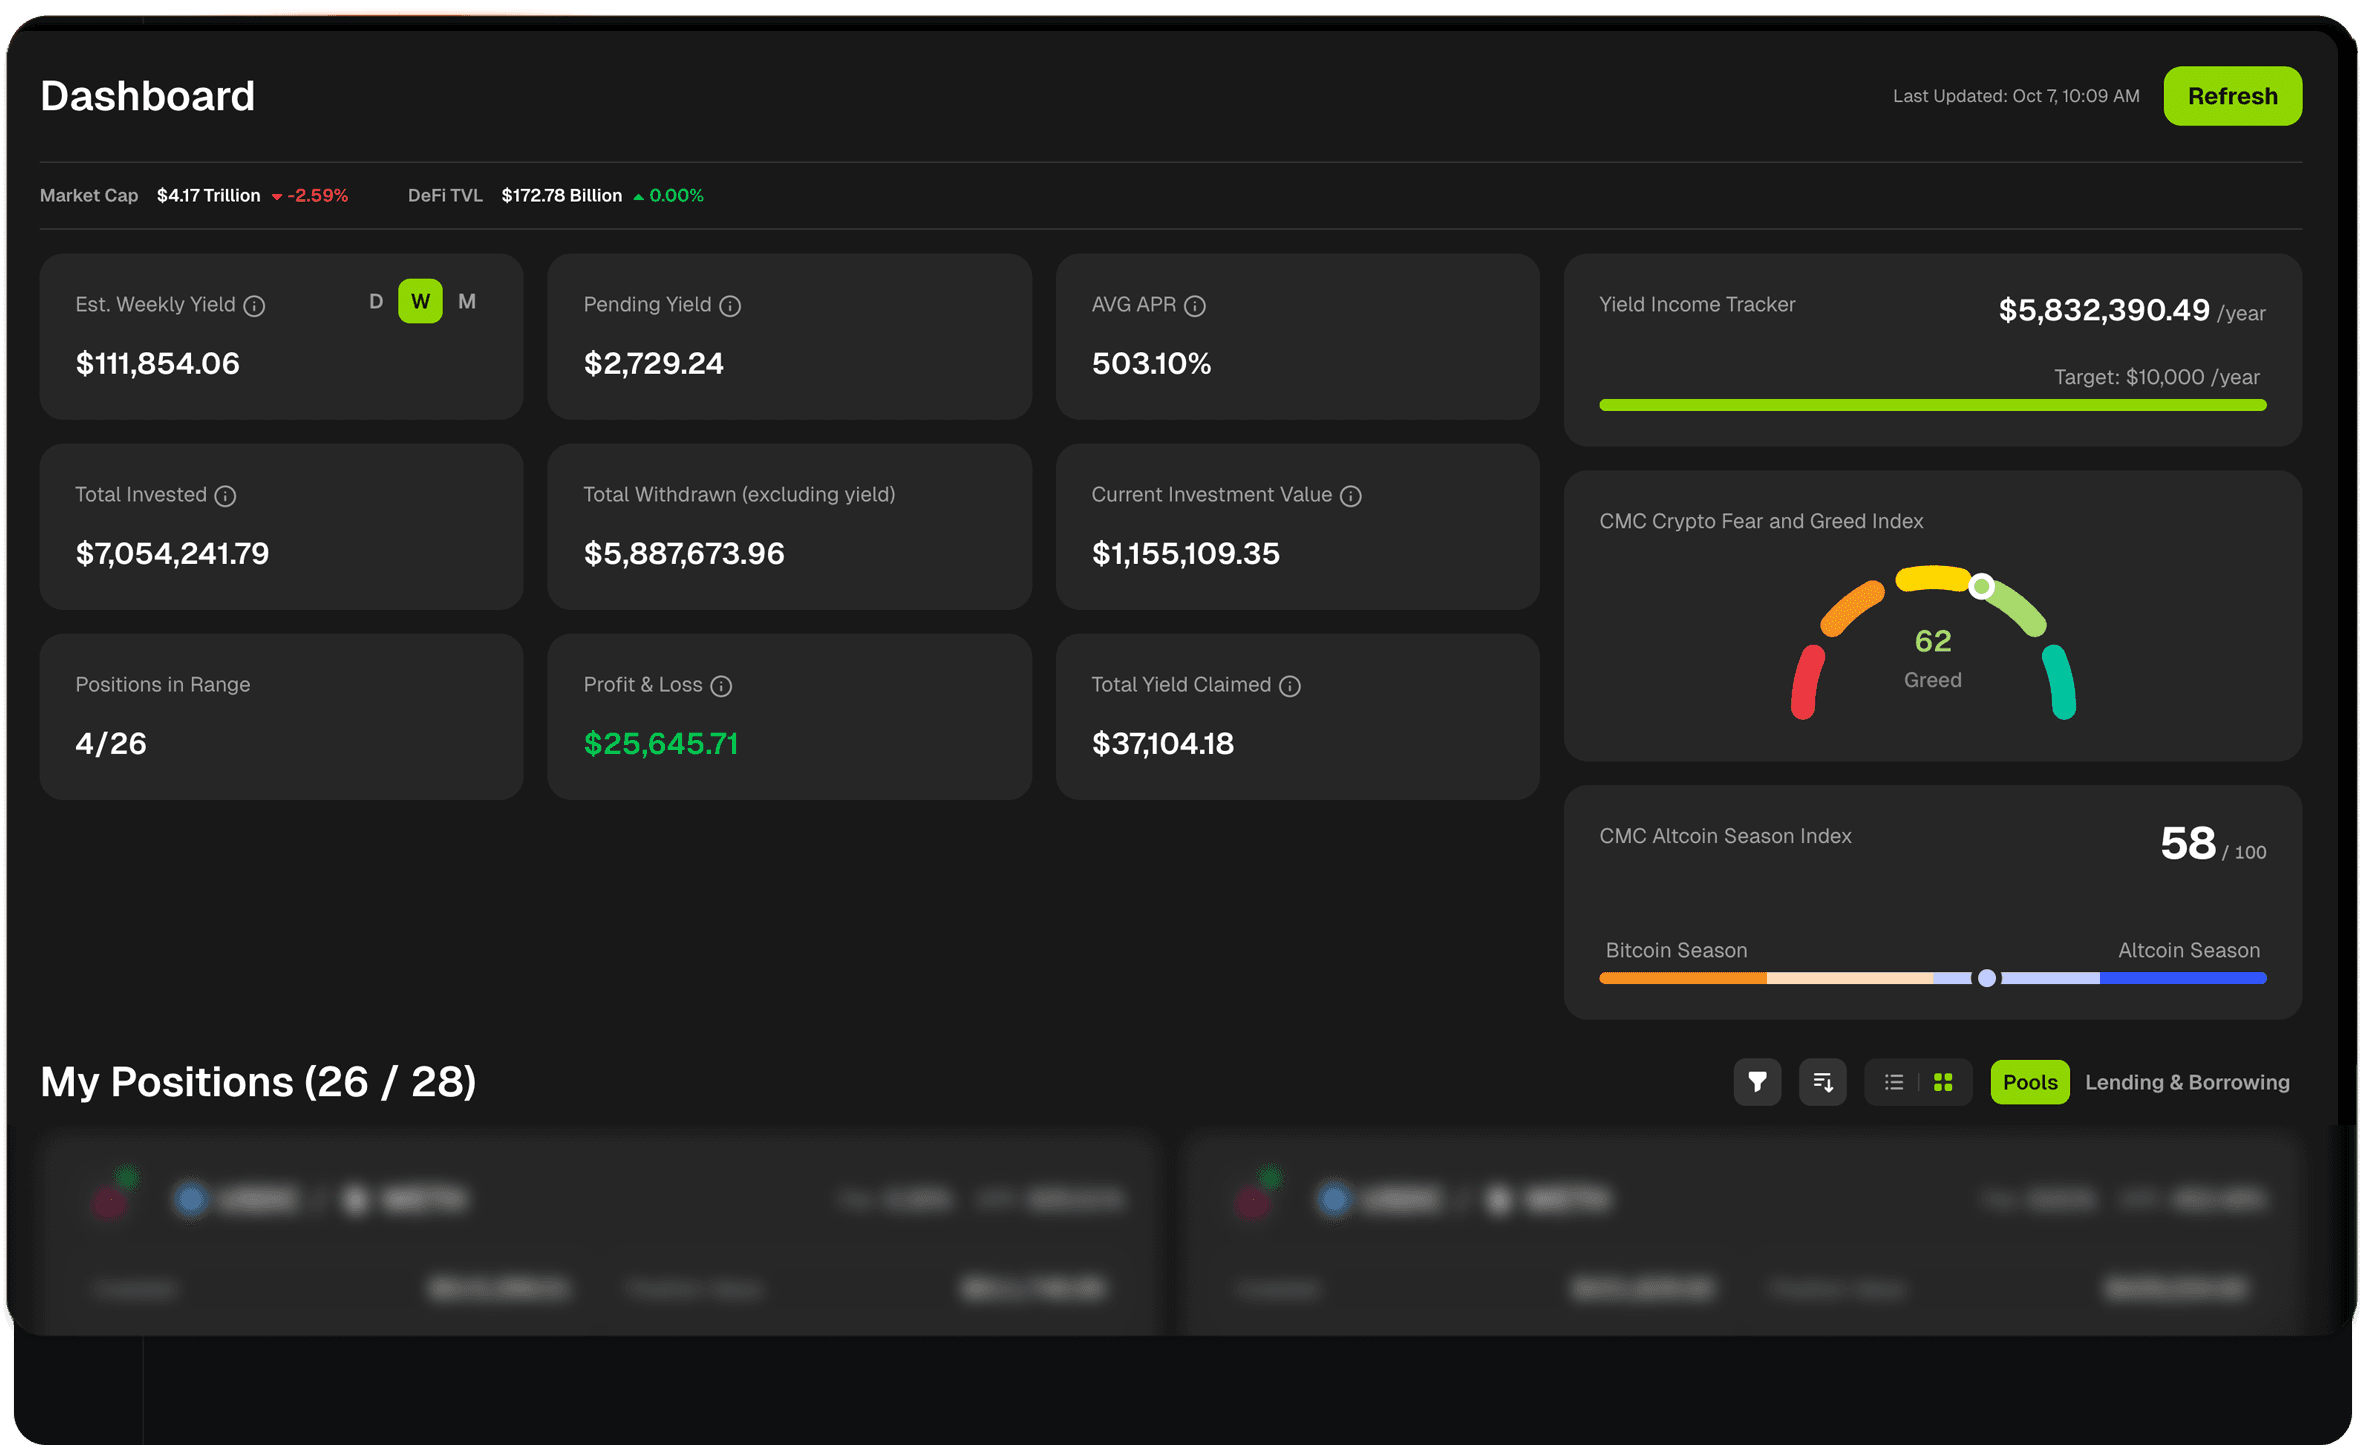
The dashboard shows live data for critical metrics like prices, range status, and yields. Use the Refresh button to pull the latest blockchain data on demand—manual refreshes are subject to a daily limit depending on your plan (unlimited on higher tiers), and the counter resets daily. The dashboard offers two metric layouts—Basic and Advanced—that you can toggle between depending on how much detail you want at a glance.Market Context Bar
These metrics help you understand the broader market context for your investments.
Key Performance Metrics
The main dashboard displays your most important portfolio metrics in easy-to-read cards:Yield Income Tracker
If you set an annual yield income target, you’ll see a progress tracker showing:
Important: Only in-range positions that are actively earning fees count toward your projection. Out-of-range positions are excluded from this calculation since they’re not generating yield.
You can update your yield income target anytime from your Investor Profile.
Market Sentiment Indicators
On your dashboard, you’ll find market sentiment tools: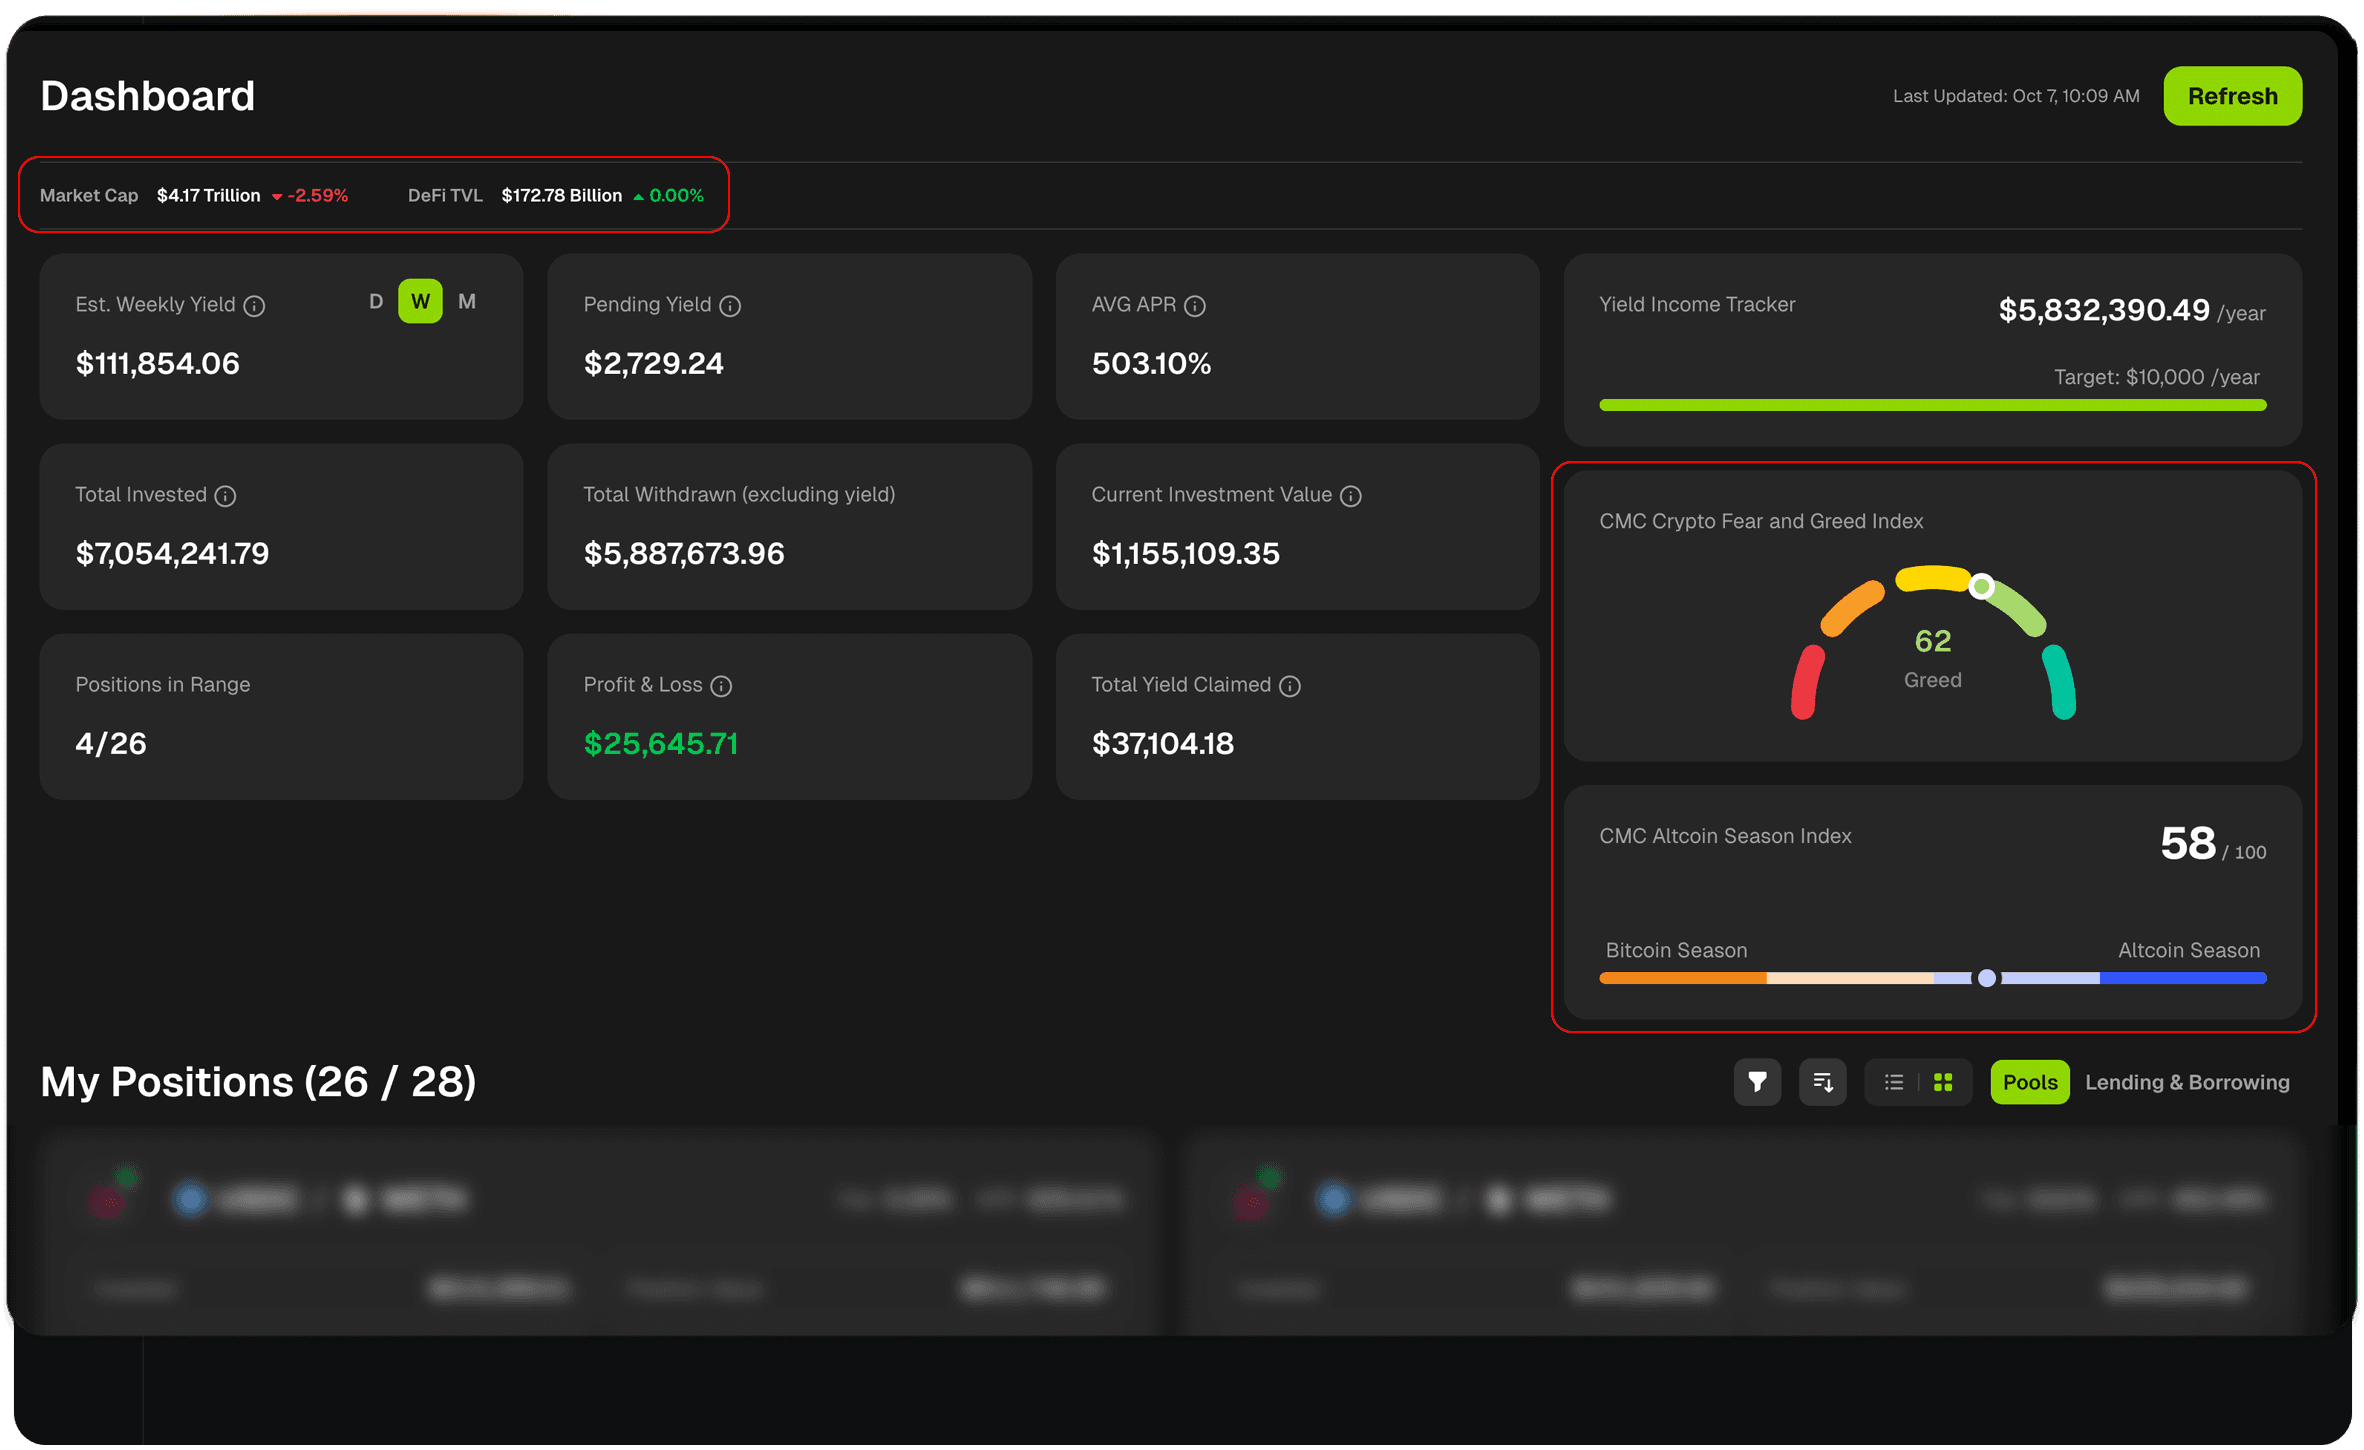
CMC Crypto Fear and Greed Index
A visual gauge showing current market sentiment from “Extreme Fear” to “Extreme Greed.” How to read it:- Red zone (0-25): Extreme Fear - Market may be oversold
- Orange zone (25-45): Fear - Cautious market sentiment
- Yellow zone (45-55): Neutral - Balanced market
- Light Green (55-75): Greed - Bullish sentiment
- Green (75-100): Extreme Greed - Market may be overbought
CMC Altcoin Season Index
A numerical indicator (0-100) showing whether Bitcoin or Altcoins are performing better. How to read it:- Below 50: Bitcoin Season - BTC outperforming altcoins
- Above 50: Altcoin Season - Altcoins outperforming BTC
Understanding Your Dashboard Data
What Counts Toward Your Metrics?
My Positions Section
Below the metrics cards, you’ll see your positions, with tabs to switch between Positions (liquidity pools) and Lending & Borrowing. For the full table view with customizable columns, open DeFi Positions from the sidebar.Position Filters & Views
Use filters to quickly find specific positions or focus on what matters most. When filters are active, both the position count and dashboard metrics update to reflect only the filtered positions. Active Filter Indicator When any filter is enabled, you’ll see an indicator and the position count will update. For example: “My Positions (4/23)” means 4 out of 23 total positions match your current filters.Important: Filters also update your Key Performance Metrics cards at the top of the dashboard, showing data only for the filtered positions.
Filter Options:
Sort Options
Organize your positions by different criteria, each in ascending or descending order: Switch between two display formats: